
Key Takeaways
- 70% to 80% of MQLs are never accepted by sales, per a sales funnel compilation, and the exact figure shifts by stage.
- Five hidden causes drive poor lead quality: no ICP, decaying data, one contact per account, slow follow-up and misalignment.
- Cost per qualified opportunity beats cost per lead: in our illustrative model, a $200 lead beat a $50 lead.
- The ARS Lead Quality Loop: Define, Verify, Qualify, Nurture, Hand off, with rejection reasons feeding back to step one.
- A free 20-page whitepaper from ARS B2B Social Bridge adds a KPI scorecard, a 90-day roadmap and a self-assessment.

Here is an uncomfortable number. Most B2B marketing leads never turn into revenue, and one funnel compilation puts the share of MQLs that sales never accepts at 70% to 80%. If you want to know how to improve lead quality, stop adding volume and fix the system that scores, checks and hands over leads. This guide from ARS B2B Social Bridge covers five hidden causes, a five-step fix and the KPIs that prove it works.
We also packed it into a free 20-page whitepaper. Grab it below, then read on for the short version.
Why Do 70% of B2B Leads Go Cold?
Most B2B leads go cold because they are counted before they are checked. Forms capture anyone, scoring rewards activity over fit, and follow-up arrives late. One sales funnel compilation reports that 70% to 80% of marketing qualified leads are never accepted by sales, and the exact figure shifts by stage.
Take 100 leads and follow them through a typical B2B funnel. A Landbase compilation puts the lead to MQL rate near 31%. Salesforce’s State of Marketing 2024 puts MQL to SQL at about 13%. Assume a quarter of SQLs close, and one customer is left. That last step is our own assumption, so read the table as an illustration.
| Funnel stage | Of 100 leads | Source |
|---|---|---|
| Leads captured | 100 | Starting point |
| Become MQLs | 31 | Landbase compilation |
| Accepted as SQLs | about 4 | Salesforce State of Marketing 2024 (13%) |
| Customers | about 1 | Assumed 25% close rate, illustrative |
The biggest leak is the handoff. A sales funnel compilation from shno.co (2025) says 44% of sales reps never follow up with a lead at all, and that waiting 48 hours or more cuts conversion by 60%. Treat both numbers as directional, since they come from a secondary compilation.
How to Improve Lead Quality When Nobody Agrees What a Lead Is?
Start by writing one shared definition. A lead is anyone who shows interest, an MQL fits your ideal customer profile and engages, a SAL is an MQL that sales agrees to work, and an SQL has confirmed need, authority, budget and timing. Both teams sign that page before any campaign runs.
Most lead quality arguments start with a vocabulary problem. Marketing counts a form fill as a lead. Sales wants a buyer. Neither is wrong, and that is exactly the trouble. If this sounds familiar, our piece on why sales ignores marketing leads covers the same friction from the sales side.
| Stage | Who decides | What it should mean | Typical failure |
|---|---|---|---|
| Lead | Marketing | Interest shown and contact details shared | Students, competitors and job seekers counted |
| MQL | Marketing | Fits the ideal customer profile and engages | Scored on activity alone |
| SAL | Sales | An MQL that sales reviews and agrees to work | No time limit, so MQLs sit untouched |
| SQL | Sales | Need, authority, budget and timing confirmed | Qualified on one contact, not the buying group |
Fix the words before you touch a campaign. A one-page definition, signed by both teams, does more for lead quality than another round of ad tests. For a closer look at benchmarks and scorecards, see the B2B lead quality report from ARS B2B Social Bridge.
What Are the 5 Hidden Causes of Poor Lead Quality?
Five causes show up again and again: no enforced ideal customer profile, decaying contact data, one contact treated as a buying group, slow follow-up, and misaligned scoring between sales and marketing. None is a campaign problem on its own. Together they form a system problem, which is why buying more leads rarely helps.
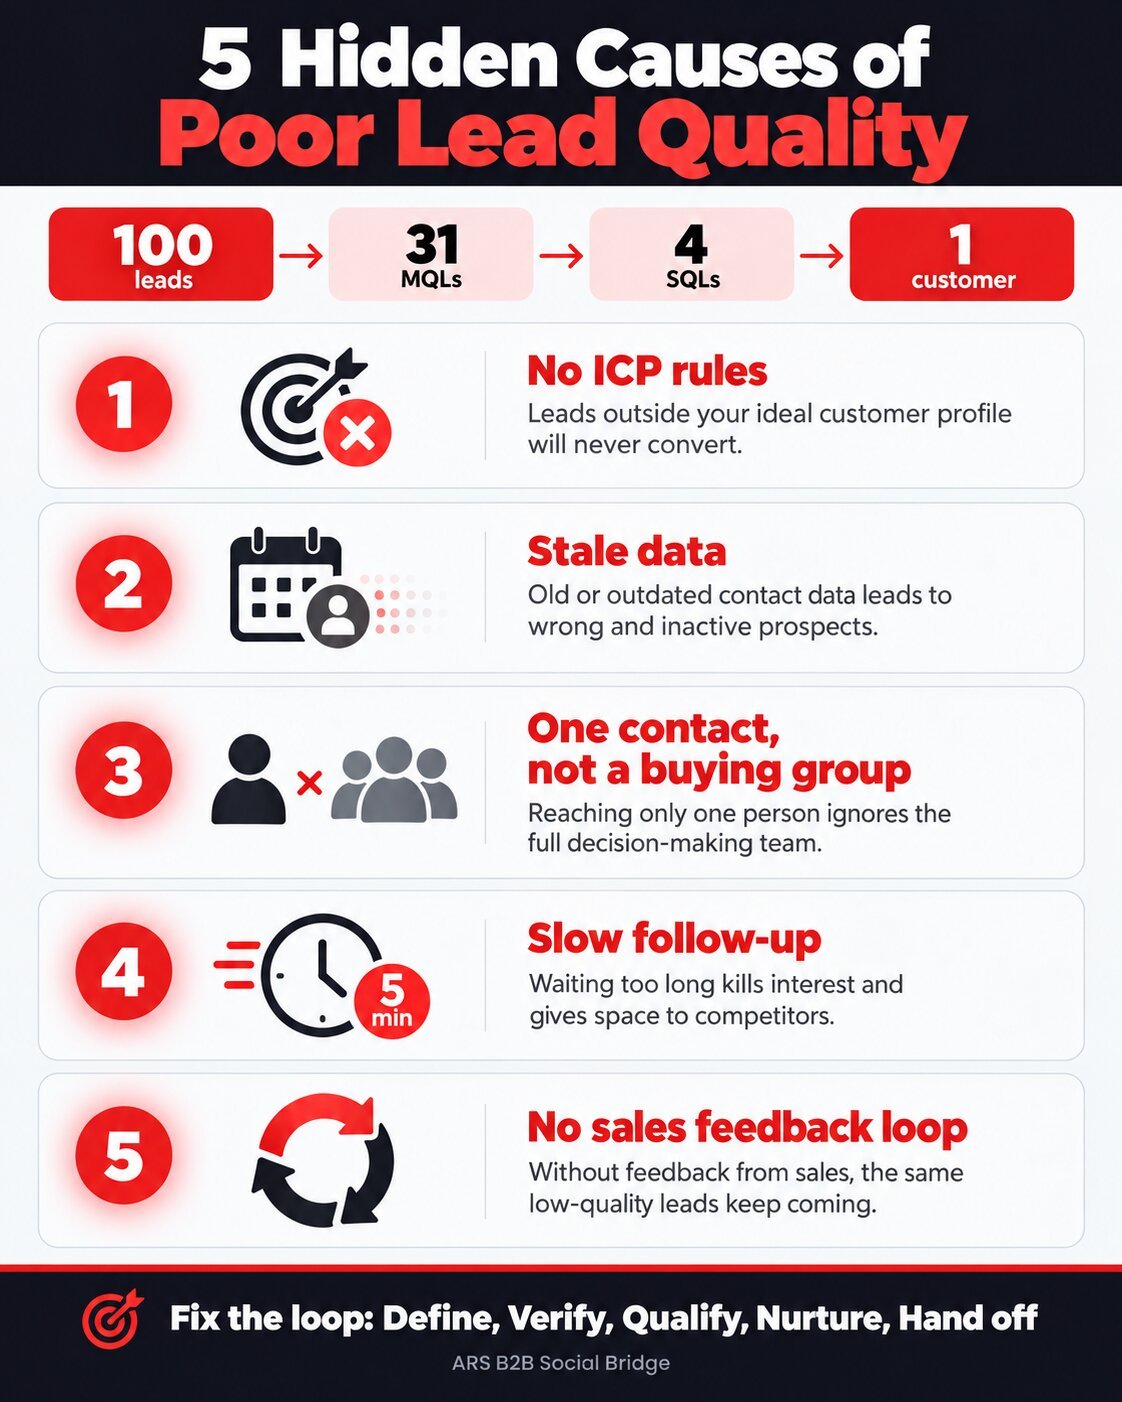
Knowing how to improve lead quality starts with knowing which of these five is hurting you most.
1. No ideal customer profile enforcement
Without an ICP, any form fill is “a lead”. Marketing counts it, sales receives it, and nobody asks whether the company has the right size, industry or budget. One benchmark guide lists missing ICP enforcement as a leading cause of low MQL to SQL conversion.
Here is a quick test. Pull the last 50 leads sent to sales and count how many sit outside your ICP. Anything above 20% means qualification starts too late.
2. Decaying, unverified data
People change jobs and mailboxes close. A widely cited estimate puts annual B2B contact decay at 22.5%, while other sources say 25% to 30%. On a 10,000 record database, that is 2,500 to 3,000 lost contacts a year. Gartner’s 2020 estimate puts the average cost of poor data quality at $12.9 million per organization.
3. One contact instead of a buying group
A form fill is one voice. The purchase is a group decision. Gartner’s 2024 B2B Buying Survey reports 6 to 10 decision makers in a typical buying group, and 77% of buyers call their last purchase very complex or difficult. Forrester’s State of Business Buying 2026 counts 13 internal stakeholders plus nine external participants per purchase.
So a quality lead is a contact inside an account where you can name at least two other roles. Judge the account first, then the person.
4. Slow follow-up
Interest is perishable. The MIT and InsideSales.com Lead Response Management Study (Oldroyd, 2007) found 21 times higher odds of qualifying a lead at five minutes than at thirty. A Harvard Business Review study of 2,200+ firms found an average first response of 42 hours among firms that replied within 30 days.
5. Sales and marketing misalignment
Marketing is measured on volume and cost per lead. Sales is measured on pipeline and win rate. When scoring rewards activity, such as three whitepaper downloads, marketing hits its target while sales gets contacts who are not ready. Sales then ignores the next batch.
- No written MQL definition that sales has approved
- No time limit for sales to accept or reject a lead
- No reason codes when a lead is rejected
- No recurring meeting to review rejected leads
The upside is real. The Digital Bloom (2025), as cited by shno.co, reports MQL to SQL near 40% for enterprise B2B SaaS teams with advanced scoring and tight alignment, against a 13% average.
Why Does Cost per Lead Hide the Real Cost of Poor Lead Quality?
Cost per lead only divides spend by form fills, so it rewards volume. Cost per qualified opportunity divides spend by sales-accepted opportunities, so it rewards quality. In our illustrative model below, a $200 lead costs four times more than a $50 lead, yet it produces opportunities at a lower price.
Cost per lead is the easiest number in B2B marketing to report and one of the easiest to game. This is an illustrative model, not ARS B2B Social Bridge client data. Both programs spend $30,000.
| Metric | Program A: volume | Program B: verified |
|---|---|---|
| Leads delivered | 600 | 150 |
| Cost per lead | $50 | $200 |
| Lead to opportunity rate | 4% | 20% |
| Opportunities created | 24 | 30 |
| Cost per qualified opportunity | $1,250 | $1,000 |
Program B costs four times more per lead and still wins. Sales also works 150 leads instead of 600. For context, the Demand Gen Report 2024 benchmark survey, as cited by The Starr Conspiracy, puts median B2B cost per MQL at $198. Your target depends on deal size and sales cycle.
The method matters more than the number. Always report cost per qualified opportunity next to CPL. If you are weighing channels, our ranking of B2B lead generation channels by SQL cost shows the same logic at work, and the content syndication cost trap explains where cheap leads hide their price.
How to Improve Lead Quality in 5 Steps?
Use a loop, not a funnel: Define the ideal customer and buying group, Verify data before counting a lead, Qualify on fit plus intent, Nurture leads that are not ready, and Hand off inside a time limit. Rejected leads then feed back into step one, so every cycle sharpens your targeting.
We call this the ARS Lead Quality Loop. A funnel only measures what falls out at the bottom. A loop uses every outcome, including rejected leads and stalled deals, to sharpen who you target next.
| Step | What you do |
|---|---|
| 1. Define | Agree the ideal customer profile, the buying group roles and one shared definition of Lead, MQL, SAL and SQL. |
| 2. Verify | Check email, company match, seniority and consent before a lead is counted toward any target. |
| 3. Qualify | Score on fit and intent together, then route by score instead of by form fill. |
| 4. Nurture | Educate leads that fit but are not ready, with a short role-specific sequence. |
| 5. Hand off | Pass sales-ready leads with context inside a service level agreement, and log every rejection reason. |
Verify before you count. Check email, company match, seniority and consent at capture. Consent rules differ by region, so see the 10-country B2B email compliance atlas before you send anything. Do not let a lead count toward a target until it passes email, company and consent checks.
Score on fit and intent. Fit asks whether they can buy. Intent asks whether they want to buy now. A demo request earns more points than a single report download, and a free email domain loses points. Be careful with surges, though. Our note on why an intent surge is not a buyer shows how scoring goes wrong. Scores sort the queue. People confirm the deal.
Hand off inside a service level agreement. Marketing promises verified, ICP-fit leads with score, source and activity history. Sales promises a first touch within five minutes in working hours, an accept or reject decision within 24 hours, and a reason code for every rejection.
Then close the loop. Hold a 30-minute weekly review of rejected leads by reason code, and update the ICP, the scoring weights or the targeting. That meeting is what turns a funnel into a loop.
Which KPIs Prove Your Lead Quality Is Improving?
Track each stage separately: visitor to lead, lead to MQL, MQL to SQL, speed to first touch, cost per qualified opportunity, rejection rate by reason and email bounce rate. Then report one number upward, pipeline created per 100 leads, because it combines volume, quality and follow-up in a single figure.
| Metric | What it shows | Reference benchmark |
|---|---|---|
| Visitor to lead | How well the site converts traffic | 2.4% median, 5%+ top quartile |
| Lead to MQL | Whether you attract the right people | 31% across industries (Landbase, 2026) |
| MQL to SQL | Whether marketing and sales agree | 13% median, 28.4% top quartile |
| MQL to SAL | Whether sales trusts the leads | 45.6% average (Forrester, 2023, as cited) |
| Speed to first touch | Follow-up discipline | Target: 5 minutes in working hours |
| Email bounce rate | Early warning of data decay | Trend monthly and investigate any rise |
Teams that ask how to improve lead quality usually have no baseline, so start measuring before you start fixing. Benchmarks come from compilations by eLearning Industry, The Starr Conspiracy and Landbase, and methods vary. Use them as reference points, not targets. Your best benchmark is your own history.
Is the Lead Quality Crisis Overstated? What Critics Say
Partly, yes. Critics point out that popular decay and response-time figures are old, vendor-reported or hard to trace to a primary study. The direction still holds, though: lead volume has outgrown lead quality. The sensible response is to benchmark your own funnel stage by stage instead of trusting any single headline number.
- Decay numbers are soft. Some analysts note the 2.1% monthly decay figure is repeated across vendor blogs with no accessible primary study.
- Speed studies are old. The headline response-time figures date from 2007 and measured contact and qualification, not closed sales.
- Not every lead needs a call. Early research downloads often respond better to content nurture, and Gartner reports that 75% of B2B buyers prefer a rep-free experience.
- A low MQL to SQL rate is not always a failure. A team sending fewer, better leads should report a higher rate than a team sending volume.
Fair points, all of them. The answer is to benchmark yourself rather than copy a number. For wider buyer research and B2B technology coverage, readers can browse IoT Insights Hub, while IoT Mail Bridge covers email and automation tools, and The Business Perspective follows business and funding news.
What Do People Ask About Improving Lead Quality?
What is lead quality in B2B?
Lead quality is how likely a lead is to become a paying customer. It combines fit, meaning the company matches your ideal customer profile, with intent, meaning the person shows real buying interest. A high-quality lead also has verified contact data and sits inside an account where you can name other buyers.
How do you measure lead quality?
Measure each funnel stage separately: lead to MQL, MQL to SQL, sales acceptance rate, rejection rate by reason code, and email bounce rate. Then add cost per qualified opportunity next to cost per lead. Pipeline created per 100 leads is the single best number to report to leadership.
What is the difference between an MQL and an SQL?
An MQL is a lead that fits your ideal customer profile and shows engagement, and marketing decides it. An SQL is a lead that sales has confirmed has a real need, authority, budget and timing. The gap between the two is where most B2B leads are lost.
How fast should sales follow up on a B2B lead?
Aim for a first touch within five minutes during working hours and within one hour at most. The MIT and InsideSales.com study found 21 times higher odds of qualifying a lead at five minutes than at thirty. Those figures date from 2007, so treat them as direction, not a promise.
Why is cost per lead a poor metric?
Cost per lead divides spend by form fills, so it rewards volume whether or not those leads can buy. A cheap lead that never reaches sales wastes rep time. Cost per qualified opportunity connects spend to pipeline, which is why it should always be reported beside cost per lead.
How often should B2B contact data be re-verified?
Re-verify any record older than 90 days before a campaign send, and track email bounce rate every month. A widely cited estimate puts B2B contact data decay at 22.5% a year, though sources range from 22.5% to 30%. Rising bounces are your own early warning that the database is ageing.
So, What Is the Fastest Way to Improve Lead Quality?
The fastest route is to fix the handoff. Write one shared definition of an MQL, verify data before counting a lead, score on fit and intent, and give sales a time limit with rejection reason codes. Those four changes are cheap, and they work on leads you already have.
More leads will not fix a leaking funnel. A shared definition, verified data, fit-and-intent scoring and a firm handoff will, and none of it needs a bigger budget. Start with the last 50 leads sales rejected and sort them by reason code. The pattern will tell you which of the five causes to fix first.
If you want the full playbook, including the KPI scorecard, the 90-day roadmap and a 12-point self-assessment, the whitepaper is free. Knowing how to improve lead quality is mostly a matter of discipline, and ARS B2B Social Bridge built this guide to make that discipline easier to start.
- MarketingSherpa B2B Benchmark Report, 2023, as cited by The Starr Conspiracy
- Salesforce, State of Marketing, 2024
- Harvard Business Review, lead response study of 2,200+ firms
- MIT and InsideSales.com, Lead Response Management Study (Oldroyd, 2007)
- Gartner, B2B Buying Survey, 2024 and May 2025 survey
- Forrester, State of Business Buying, 2026
- Gartner, 2020 estimate of the cost of poor data quality
- Demand Gen Report, 2024 benchmark survey, as cited by The Starr Conspiracy
- The Digital Bloom, 2025, and shno.co sales funnel statistics, 2025
- Landbase, eLearning Industry and RevNew benchmark compilations, 2026
The funnel and cost examples are illustrative models, not ARS B2B Social Bridge client data. Benchmarks vary by method and market.