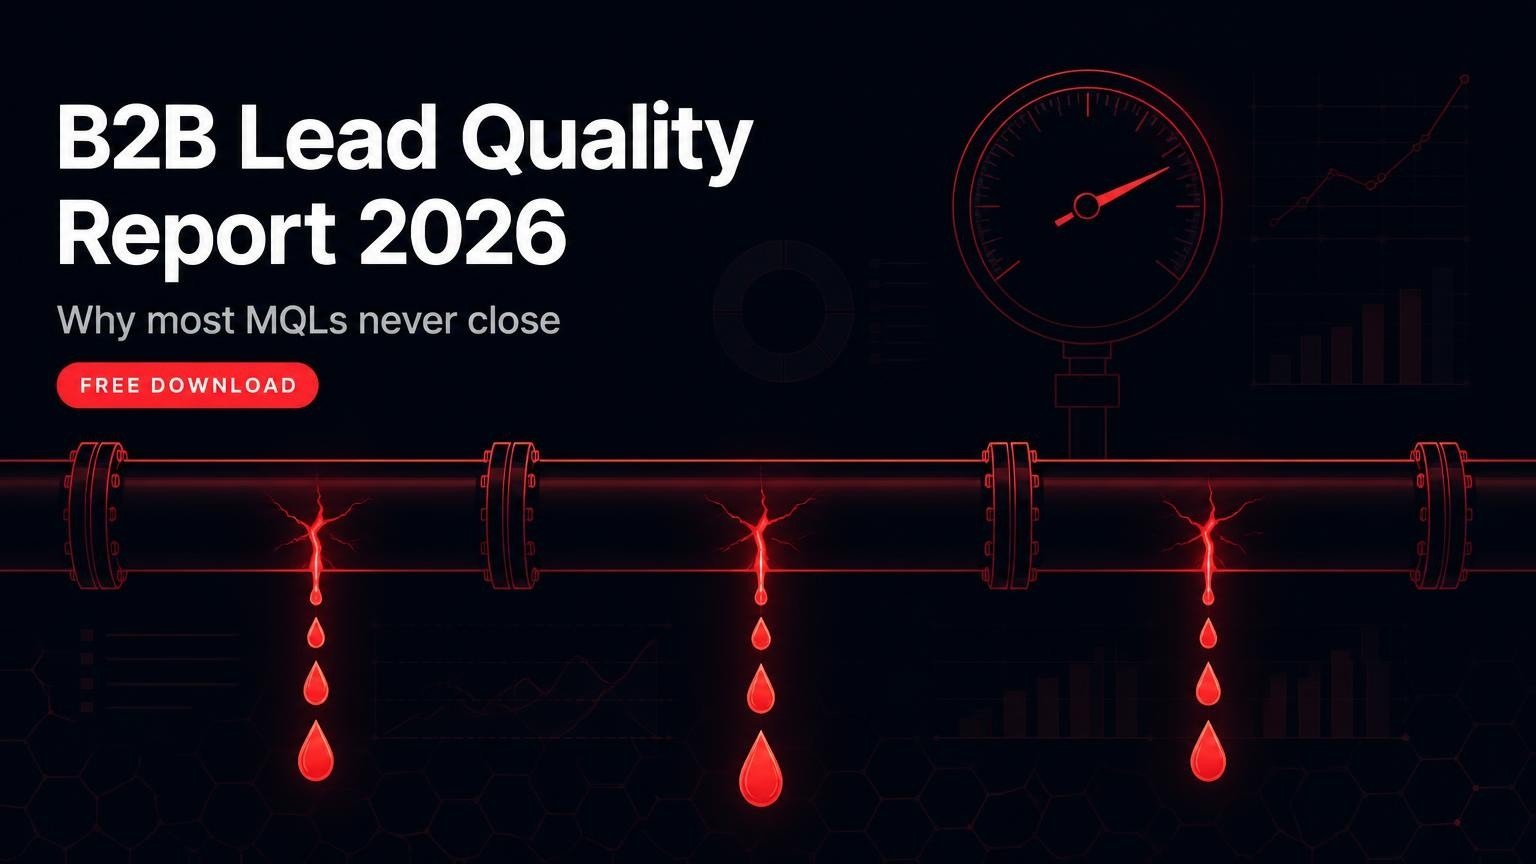
Most B2B teams count leads. Far fewer count the leads that sales actually accepts. The B2B lead quality report 2026 from ARS B2B Social Bridge closes that gap with sourced benchmarks, and you can download the full 26-page PDF for free.
This article gives you the short version: where leads leak, what AI-first buyers changed, what a lead really costs and how to grade any lead source. It draws on named research from 6sense, G2, Forrester, Gartner, SaaS Hero and MIT. Try this first: ask your sales team how many of last month's MQLs they would happily call again. That answer is your starting benchmark.
Get the full B2B lead quality report
Every benchmark, table and tool from this article, plus the methodology page and the stats we chose to leave out.
- Benchmarks
- Vendor scorecard
- Lead scoring model
- Handoff SLA
- 30-day plan
Figures come from 6sense, GrowthSpree, SaaS Hero and an MIT and InsideSales.com study. Several sources are vendors or agencies, so read the numbers as directional, not exact.
What does the B2B lead quality report 2026 cover?
The B2B lead quality report 2026 is a free 26-page research paper from ARS B2B Social Bridge. It covers how AI-era buyers changed the funnel, MQL-to-SQL benchmarks and why sales rejects leads. It ends with four copy-ready tools: a vendor scorecard, a lead scoring model, a handoff SLA and a 30-day plan.
We built it for CMOs, demand generation heads and sales leaders who are tired of arguing about lead volume. Each page carries one idea, one big number and a named source. The table below shows how the report is organised.
| Chapter | Pages | What you get |
|---|---|---|
| 1. The buyer changed first | 4 to 9 | AI shortlists, buying group size, how buyers spend their time |
| 2. The funnel in numbers | 10 to 14 | MQL, SAL and SQL definitions, benchmarks, cost per SQL |
| 3. Why good-looking leads fail | 15 to 18 | Seven rejection causes, speed to lead, the syndication trap |
| 4. Fix it | 19 to 23 | Vendor scorecard, scoring model, handoff SLA, 30-day plan |
| Methodology and sources | 24 to 25 | Limits, sources and the stats we left out |
One choice is worth pointing out. We left four popular statistics out, including the widely repeated "$1 trillion misalignment" figure, because we could not trace a primary source. A shorter report with checkable numbers beats a longer one with borrowed ones.
Why do most MQLs never reach sales?
Most MQLs never reach sales because the typical MQL-to-SQL rate sits near 13% in 2026 benchmarks from GrowthSpree and SaaS Hero. That leaves about 87 of every 100 MQLs stalled. Usual causes are vague MQL definitions, slow follow-up, weak contact data and no agreed rejection reasons.
Here is the catch. Every study defines "MQL" differently, so the numbers below are a mirror, not a target. Use them to see where your own funnel is unusually weak.
| Stage | Figure | Source |
|---|---|---|
| Visitor to MQL | 1.8% median | Visionary Marketing, Q1 2026 |
| Lead to MQL | 25% to 35% average | SaaS Hero, 2026 |
| MQL to SQL | About 13% median | GrowthSpree (First Page Sage data) and SaaS Hero |
| MQL to SQL | 18% to 22% average | Data-Mania, 2026 |
| MQL to SQL | 39% to 40% with behavioural scoring | SaaS Hero, 2026 |
| SQL to opportunity | 38.4% median | Visionary Marketing, 2026 |
| Opportunity to closed-won | 23.8% median | Visionary Marketing, 2026 |
What the medians mean for 1,000 MQLs
ARS calculation using the Visionary Marketing medians. Illustrative, not a forecast.
Channel matters too. SaaS Hero's 2026 data, drawn from B2B SaaS, shows SEO leads moving from MQL to SQL at 51% and PPC leads at 26%. Sectors such as services or manufacturing will differ, so treat it as a direction.
Why does sales reject the rest? RollWorks surveyed 527 salespeople and 323 marketers. Reps said they skip leads that miss the target account or target person criteria. We covered the handoff side in our guide on sales ignoring marketing leads.
How do AI-era buyers change B2B lead quality?
AI-era buyers arrive with a shortlist already built. 6sense found 94% of buying groups rank preferred vendors before first contact, and G2 found 51% of software buyers start research in an AI chatbot. A form fill is now late validation, not the start of interest.
That changes what a good lead looks like. By the time someone fills in your form, they may have spoken to a chatbot, read peer reviews and shared notes with colleagues. The table lists what four recent studies found.
| Source | Sample | Finding |
|---|---|---|
| 6sense, 2025 | About 4,000 buyers | 94% rank preferred vendors before first contact; 83% define requirements before speaking to sales |
| G2, March 2026 | 1,076 software buyers | 51% start research in an AI chatbot; 69% chose a different vendor after chatbot guidance |
| Forrester, 2026 | Nearly 18,000 business buyers | 94% used generative AI in their most recent purchase |
| Wynter, January 2026 | 101 mid-market SaaS CMOs | 84% use AI for vendor discovery, up from 24% in 2025 |
Three rules follow, and the report spells them out:
- Score the account as well as the person, because 6sense counts about 10 people in a typical buying group.
- Track the SAL rate, meaning the share of MQLs sales accepts, not only MQL volume.
- Publish useful, citable research openly, so buyers and AI tools find you before the form.
Teams that track AI-search visibility can follow tooling coverage on IoT Insights Hub. Most of these surveys come from vendors that sell AI or visibility tools, and most cover software buyers. Read the direction, not the decimals.
What does a B2B lead really cost?
A lead costs more than its price tag because only a fraction reaches sales. Divide cost per MQL by the MQL-to-SQL rate to get cost per SQL. At SaaS Hero's $213 median cost per lead, a 13% rate means about $1,638 per SQL, while a 30% rate brings it to $710.
This is the number your CFO will care about. Cost per lead looks cheap until you divide it by the share that sales accepts.
| MQL-to-SQL rate | SQLs from 1,000 MQLs | Cost per SQL |
|---|---|---|
| 5% | 50 | $4,260 |
| 13% (typical) | 130 | $1,638 |
| 22% | 220 | $968 |
| 30% | 300 | $710 |
| 39% (behavioural scoring) | 390 | $546 |
Replace $213 with your own cost per lead. Costs also vary by sector: Prospeo reports about $650 per lead in legal services and about $391 in manufacturing. Founders defending marketing spend to investors will find a similar discipline in The Business Perspective's guide to raising seed funding for startups.
How fast should sales respond to a new lead?
Respond in minutes for high-intent leads. The MIT and InsideSales.com study found leads contacted within 5 minutes were 21 times more likely to qualify than those contacted at 30 minutes. The study dates from 2007, but later research points the same way.
Most companies still reply in hours, and some take days. The cards show how the evidence stacks up.
Set a clock for every lead tier. The report's handoff SLA suggests 5 minutes for demo or contact requests, 1 hour for scored MQLs and one business day for the accept-or-reject decision. These defaults are ARS suggestions, so adjust them to what your team can meet. Teams building alerts and routing rules can follow workflow automation coverage on IoT Mail Bridge.
What is the content syndication trap?
The trap is judging a programme by total leads instead of usable leads. RevNew's example shows 300 leads at a 55% ideal-customer match give 165 usable leads, while 200 leads at 85% give 170. The smaller programme wins. Always ask for match rate, bounce cap and cost per opportunity.
RevNew also flags a hard bounce rate above 5% as a data quality problem, and Reach Marketing calls cost per lead one of the most misleading syndication metrics. At a 15% SAL-to-opportunity rate, 100 syndicated leads give about 2 to 4 opportunities, per RevNew. Before you buy, ask:
- What is the ideal-customer match rate, in writing?
- Which content did each lead consume, and for how long?
- What is the hard bounce cap, and how is it checked?
- Will invalid leads be replaced at no cost?
- Will you report cost per opportunity, not only cost per lead?
How do you score a lead and grade a vendor?
Grade vendors with a 10-question scorecard worth 100 points. Score leads with a 100-point model split into Fit 40, Intent 30, Engagement 20 and Timing 10. In the ARS model, a score of 70 or more becomes an MQL for sales, and 50 to 69 goes to nurture.
Here is the split behind the lead scoring model. Fit carries the most weight, because a perfect-fit account with modest activity beats a keen student with a free email address.
Fit 40 · Intent 30 · Engagement 20 · Timing and data 10. Negative scoring removes up to 20 points for competitor, free-email or hard-bounce signals.
Vendor lead quality scorecard
Ten questions, 10 points each. 80 to 100 is strong, 60 to 79 means negotiate terms, and below 60 means walk away.
100-point lead scoring model
Fit, intent, engagement and timing, with negative scoring and clear thresholds for hold, nurture and MQL.
Marketing-to-sales handoff SLA
An owner, a clock and a reason code for every lead, plus a 20-minute weekly huddle agenda.
30-day lead quality fix plan
Four weeks to a shared definition, a working score and a clean source list.
The score bands and thresholds are ARS suggestions, not a published standard. Test them against your closed-won deals every quarter. ARS B2B Social Bridge builds the same logic into its Qualified Buyer Framework and its Growth Qualified Lead (GQL) framework, so leads are judged on fit and not on volume.
What do critics say about lead quality benchmarks?
Critics point out that benchmarks mix definitions, come largely from vendors and sometimes rest on old studies. Even 6sense's own headline has a control case that tells a different story. Treat every figure as directional, and check the original report before you quote it in a board deck.
6sense reports that buyers contact the eventual winner first about 80% of the time. SerpSculpt notes that where the first vendor contacted was tracked, that vendor won 57% of the time, not 80%. The preference formed earlier.
The Gartner time-split study is from before the pandemic. Critics say buyers have always spent most of their time in internal meetings, so "5% to 6% of time with one supplier" is often misread.
Most AI-usage surveys come from companies that sell AI or visibility tools, and many cover software buyers only.
That is why the report has a methodology page. It lists our limits, and the stats we dropped because we could not verify them. ARS B2B Social Bridge would rather show the gaps than hide them.
What do marketers ask most about B2B lead quality?
Marketers mostly ask what a good MQL-to-SQL rate is, how MQLs differ from SQLs, how to work out cost per SQL and how fast to follow up. The six answers below use named sources, and several come from vendor research, so check them against your own CRM first.
What is a good MQL-to-SQL conversion rate?
Benchmarks vary by definition. GrowthSpree and SaaS Hero report a median near 13%, Data-Mania reports 18% to 22% on average, and SaaS Hero reports 39% to 40% for teams using behavioural scoring. Compare your rate with your own history first, then with any industry average.
What is the difference between an MQL and an SQL?
An MQL fits your profile and has engaged with your content. An SQL has a confirmed need, timeline and budget. Between them sits the SAL, a lead that sales has formally agreed to work. Per Prospeo, every benchmark study defines these terms differently, so write your own definitions down.
How do you calculate cost per SQL?
Divide cost per MQL by the MQL-to-SQL rate. At a $213 cost per lead and a 13% rate, cost per SQL is about $1,638. At 30%, it falls to $710. The $213 median comes from SaaS Hero, so replace it with your own figure before you plan budgets.
How fast should you follow up with a B2B lead?
For demo or pricing requests, aim for minutes, not hours. The MIT and InsideSales.com study found leads were 21 times more likely to qualify at 5 minutes than at 30. HubSpot research, as reported by Amplemarket, puts the average B2B inbound response at 42 hours.
Is the B2B lead quality report free to download?
Yes. The B2B lead quality report 2026 from ARS B2B Social Bridge is a free 26-page PDF. It includes sourced benchmarks, a vendor scorecard, a 100-point lead scoring model, a handoff SLA template and a 30-day fix plan. Use the download button on this page.
Why is content syndication lead quality often low?
Syndicated leads often download an asset with little buying intent. RevNew's example shows 300 leads at a 55% match give fewer usable leads than 200 at 85%. Abmatic puts typical MQL-to-SQL at 5% to 15%. Ask for match rate, bounce caps and cost per opportunity.
What should you do first after reading the B2B lead quality report?
Start with a shared definition. Write one page that defines lead, MQL, SAL, SQL and opportunity, and have both team leads sign it in week one. Then switch on scoring and the handoff SLA, audit your sources by cost per SQL, and review the results at day 30.
- Week 1: Agree the words. One page, one ideal customer profile, both heads sign.
- Week 2: Install the rules. Scoring model version 1, the handoff SLA and six reason codes in your CRM.
- Week 3: Audit the sources. Work out cost per SQL by channel and vendor. Score each vendor.
- Week 4: Review and reset. Compare score bands with real outcomes, cut the weakest source and set targets.
Track five numbers: SAL acceptance rate, MQL-to-SQL by source, median response time, cost per SQL and cost per opportunity. Take the baseline in week one, then measure again at day 30 and day 90.
Lead quality is a shared job, and the B2B lead quality report gives both teams the same page to work from. Download it, share it with your sales head and run the 30-day plan. ARS B2B Social Bridge screens buyers before delivery, so every lead arrives with fit and intent attached.
Download the free B2B lead quality report 2026 from ARS B2B Social Bridge. Benchmarks, scorecard, scoring model, SLA and 30-day plan in one 26-page PDF.
Download the free PDF